Metrics
Tiresome, vague, and lazy: Why TVL is not the be-all and end-all of metrics
The DeFi space has long used Total Value Locked (“TVL”) as the primary indicator of the success of a protocol (e.g.

Volume
DeFi protocols do not tend to seek high TVL for the sake of high TVL itself; they seek higher TVL because it will be more efficient than a version of itself with lower TVL. This would allow a protocol to facilitate greater volume, either through higher swap volumes, higher borrowed amounts, or higher open interest.
Therefore, it is valuable to assess the direct impact that higher TVL has on a protocol. If a protocol was able to achieve significant growth in TVL but stagnant volumes, it may suggest that there is a surplus of “idle” liquidity that is being underutilized.
Similarly, this paradigm exists in money markets too. A higher utilization rate (being the total borrowed value as a ratio to total deposited value) creates a healthy ecosystem where lenders are fairly compensated for their liquidity which helps manage the long-term retention of depositors. This is important for borrowers as it reduces the volatility of open loans. While Nolus fixes the interest rate on leases, long-term retention of depositors is critical as it allows existing users to open new leases at comparable rates and is also a sign of strength that can help attract new borrowers.
Consequently, many analysts use “Volume / Total Value Locked” as a metric for protocol growth. This allows individuals to compare liquidity utilization between protocols and/or relative growth (or regression) for a protocol in response to a change in TVL.
Incentives
It is very important to consider the impact of incentives on a protocol’s position. Incentives will result in a short-term boost in TVL that may overemphasize the protocol’s attention, traction, and competitiveness. However, these may be counterproductive to the protocol’s long-term future and sustainability.
Therefore, it is important to assess the long-term trends in TVL (among other metrics) to obtain data that is normalized for “real” liquidity as opposed to inflated liquidity buoyed by incentive programs.
Efficiency
Assuming all other constants were equal, it is fair to say that a protocol with higher liquidity would be more efficient than a competitor. This would manifest as lower slippage when making a swap on a decentralized exchange or lower interest rates when borrowing on a money market.
However, the DeFi space is large. Primitives such as decentralized exchanges have an extraordinary amount of innovation and variety among competitors.
If we compare the two most basic pricing curves, we have the X + Y = K (constant sum market makers) and X * Y = K (constant product market makers) curves. Outside of these curves, we have a wide array of concentrated liquidity models that boast differing efficiencies.
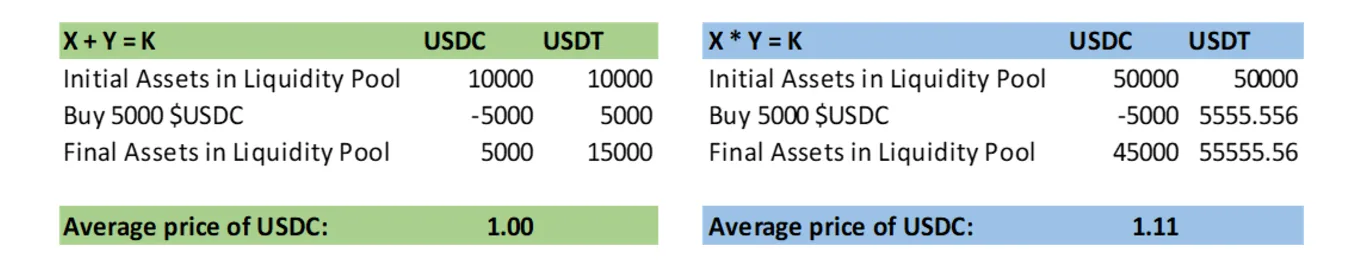
The table above presents two liquidity pools, the former is a CSMM curve while the latter is a CPMM curve with five times the liquidity of the former. However, due to the extreme efficiency of the CSMM curve (which also has its own issues), it can facilitate swaps at significantly better prices than the CPMM curve even with a fraction of the liquidity.
While modern decentralized exchanges do not use CSMM curves, the concentrated liquidity models implemented by UniSwap v3, Curve v2, and Trader Joe all give rise to a scenario where efficient models can compete with less efficient models with a fraction of the liquidity.
In this instance, it may be more valuable for individuals to compare protocols (to historical data, or to a competing protocol) by looking at pool depth and slippage. This would better allow individuals to understand which decentralized exchanges offer the best value for users.
Conclusion
TVL as a metric has taken over the DeFi space purely because it is easy to find and compare values between two competitors. However, there is an abundance of metrics that make sense to use when comparing protocols, and it could be argued that TVL is a better indicator of “trust” in a protocol rather than “success.”
Several other metrics are valuable in assessing the growth of a protocol (or when comparing multiple protocols). These include:
- Volume / Total Value Locked (%): As noted above, this metric helps assess the ability of a protocol to utilize the TVL that enters the protocol. Growth (or even stable returns) in this metric shows that the product is gaining traction and product, market, fit (“PMF”).
- Revenue: The vast majority of DeFi protocols are not profit-making (after the cost impact of incentives). However, another method to assess gaining PMF is by seeing revenue growth over a defined period.
- Daily Active Users: Monitoring DAU allows a protocol to evaluate its ability to grow its user base as well as retain its user base. While it is possible to grow a protocol solely with a small number of high-value users, it can be especially difficult for new protocols to achieve this.
- Churn: This metric represents the percentage of users who stop engaging with the protocol over a defined period. High churn rates indicate difficulty in retaining users, while lower churn rates demonstrate strong user loyalty and satisfaction.
- Community Growth: Similar to the above, community growth is especially valuable for a DeFi protocol. It shows confidence in the protocol if neutral members of the crypto space are able to speak positively about the protocol and ally themselves with it.
Nolus finds these metrics especially critical in creating a platform for its long-term success. The core team monitors these metrics internally and strives to grow each of them.
Read next in
Metrics
 Metrics
Liquidation Impacts
In mid-October 2025, the crypto market experienced its sharpest single-day deleveraging event to date.
4 min read Deep Dives
When the Weakest Link Isn't the Code
In April 2026, Drift Protocol lost $285M in 12 minutes, not to a smart contract exploit. The attack pattern has shifted from breaking code to compromising control.
6 min read Metrics
Nolus in 2025: A Year in Review
From DeFi leasing to asset-backed margin leverage, smarter liquidations, and trust-minimized expansion beyond Cosmos
4 min read